

There Is Nothing Exceptional About US “Exceptionalism”
By Peter Tchir of Academy Securities
On Friday, after the jobs report, we heard a lot of chatter about “Goldilocks.” While we wrote NFP – Great for Markets, we caveated that with – for now. Normally we would agree that there is a “transition” period from “everything is great,” to “everything is bad.” While I’m not saying that everything is bad, I do wonder if we can have more of a “gap” than a transition, largely due to the influence that “American Exceptionalism” has had on people’s perceptions. According to Google Trends, the term peaked on searches this year the week of February 4th and is declining again
Yes, there are some things that have been exceptional. AI has certainly been exceptional on many fronts. The U.S. efforts to help stop Iran’s missile barrage was also exceptional. Away from that, I’m seeing less and less “exceptionalism.” Normally that wouldn’t matter, but I can’t help but wonder if the use of that term has made us interpret data too positively? That we ignore negatives and dwell on positives that support that theory? I’m concerned that we are, which means that we might have less of a transition than a gap, as investors start looking beyond earnings (indicatively, as BofA’s Michael Hartnett just wrote, “US exceptionalism is driven by ‘exceptionally’ easy fiscal policy.”).
Market Exceptionalism
It would be easy to understand if the proverbial “person in the street” thought that big tech was by far the best investment possible. On any given day, American Exceptionalism battles with “You Need to Own Big Tech” for airtime. Heck, the term “Magnificent 7” is still bandied about, though it hasn’t been a particularly useful way of expressing market moves for many months. Yet, since January 31st, other major markets have outperformed the Nasdaq 100, a good benchmark for “big tech.” Some (like China) by significant amounts. I did use the Hang Seng Index rather than Shanghai in the below because Shanghai was closed for a few days so won’t show the full performance until next week, though that performance was picked up by FXI and KWEB – the two ETFs I look at for China.
When, as a strategist, I tell people that I’ve been recommending trading the Nasdaq 100 from the short side (selling rips, as opposed to buying dips, though the behavior is similar), people look at me almost with sympathy. When I add in that I have liked China “for a trade” (I still don’t think it is investible for the longer-term), the sympathy turns to outright pity. Yet the data doesn’t warrant that perception.
What happens if more and more people start focusing on the divergence between the messaging and the actual performance?
While earnings have helped, I’ve seen a couple of things that caught my eye. I did not verify them, but they sounded reasonable:
- Sales, in particular, have been mediocre relative to inflation, and the average has been propped up by a minority of large companies that are crushing it.
- Earnings, while doing well, are heavily skewed by about 20% of the S&P 500 that is doing extremely well!
Both of these items, which seem reasonable (though I haven’t verified the data myself), would indicate that many companies are living in a world that is far from exceptional. That reality hasn’t hit more broadly, but will it, as we’ve now made it through most of the highest profile earnings reports.
“Exceptional” Economic Data
I could fill this section with so many charts, that it would test my patience with Bloomberg’s charting function. We will only go with two charts (and a separate section on jobs).

The Citi Economic Surprise Index went negative. This index is always interesting because it combines shifting expectations with changes in data. It tends to oscillate because as data comes in strong, many economists increase their expectations for future data, making it more and more difficult for the data to exceed expectations. The opposite also tends to happen. As data underperforms expectations, economists can retain their apparently lofty expectations, hoping that the data will change direction, or (and I believe far more likely) they can reduce their expectations.
Just like for earnings estimates, this process of downgrading the economic outlook could help bonds and make many question growth.
There are all sorts of reasons why we can say that the importance of the Chicago PMI as an indicator has declined (shifts in manufacturing, relative importance of the region versus other regions, etc.). Having said that, this chart caught my eye.

We’ve reached levels only seen during what could be described as “crises.” The good news is that often the bottom of PMI marked a great investment opportunity. That could be the case here, except that we are still near all-time highs, rather than having endured dramatic selloffs (like in previous bottoms). Again, I understand that this particular measure might not be as emblematic of the nation’s prospects as it once was, but this was pretty darn stark!
ISM manufacturing PMI came in below 50 (yeah, I know that we are not a manufacturing-based economy), while it had prices paid spiking and employment shrinking. ISM Services, on Friday morning amidst all the Goldilocks chatter, came in at 49.4 (yes, a service index came in below 50). That index also showed higher prices paid (59.2) with weaker employment (45.9). I’m not sure why that got so little attention, because it doesn’t seem very Goldilocks to me! Okay, the S&P Global U.S. Services Index came in at 51.3, so maybe that offset ISM services, but that isn’t a particularly strong number either.
We could explore revolving credit debt (increasing rather substantially), delinquencies (rising, but still manageable), etc., but we are running out of time and space today.
“Exceptional” Jobs Data
Non-Farm Payroll finally went from exceptional to good. But as I scour the data for confirmation of how strong jobs (as reported by the Establishment Survey) have been, I struggle to find it.
Employment seems weak in many of the surveys, as cited above.
The JOLTS data has shown a steady decline in jobs available. First, I question whether the methodology has truly captured the use of online job searches correctly. How many “stale” or even “fishing expedition” postings are out there (postings where there is no real job opportunity, but if an “exceptional” and I do mean exceptional candidate applies they would make an effort to find a job for that person).

It makes sense (regardless of how accurate the data is) that in an economy that is growing, there is a general pattern of increases in jobs available. That trendline has potentially been broken. We have about 900k more jobs available than we did in November 2018. Yes, actual jobs are more important than jobs available, but I think that we’ve moved back to a “normal” number of jobs available.
But I digress since I care more about the QUIT and HIRE rates from JOLTS. I think they tell us as much or more about the true state of the jobs market than almost any other data we get.
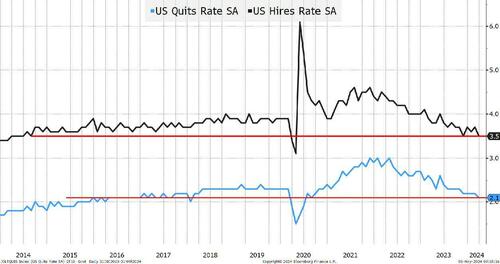
The QUIT rate, an indicator of how comfortable employees are with quitting (presumably because they believe they can find another similar or better job quite easily), has dopped to a level that is lower than in 2018 and 2019 and back to a 2015 to 2016 average.
The HIRE rate is even worse. This indicates hiring on a relative basis, and we are now back to levels seen in 2014.
We are hiring less, there are fewer jobs available, and people are seemingly afraid to quit, so let’s focus on one part. The Establishment Survey, that has a notorious track record of being revised downward by large amounts, has lower and lower initial response rates, and does “its best” to estimate business creation. The Birth/Death model (what a horrible name) provided 363,000 of the (wait, checks notes) 193,000 jobs created in the private sector.
I like my “exceptionalism” to be exceptional, and I also like my data not to be dwarfed by “plugged” numbers. My understanding of the Birth/Death model is that it relies heavily on EIN applications to determine new businesses, which I think has been overstated as anyone from rideshare drivers to people trying to make a buck on social media have applied for EINs to treat themselves as businesses.
I cannot help but wonder if even on the jobs front, which has been close to exceptional, we are exposed to some sort of gap in perception, and we might wind up finding out that Goldilocks met the wrong group of bears and the story doesn’t end so well.
Bottom Line
Lower yields. On Friday, I reiterated our range of 4.4% to 4.6% on 10s. I suggested fading the move at 4.45%. While I still think “deficits” and “supply” will push us higher, I think we have some protection here as the economic data surprises to the downside and as economists ratchet down their forecasts. And simply assuming noise around the true rate of inflation, we could see a pleasant inflation print or two. I think we can own yields here, and will bring back the range to 4.3% to 4.5% on 10s. I’m still in the 2-cut camp, which seems more likely, though I’m leaning towards June/July which seems a bit aggressive.
What do lower yields mean for stocks? That is just such a tricky question as the relationship between yields and stocks has been all over the place. I think that we will see outperformance of small caps, banks, and value here. We’ve seen the S&P 500 moderately outperform the Nasdaq 100 in the past three months and I think that we will see more sectors and industries shift into outperformance mode. We may (probably will) see stocks respond positively to lower yields. But, I am concerned that we won’t see a smooth and gradual transition from “no landing” to “soft landing” to “bumpy landing” and we will jump from “all good” to “all is not-so good” rapidly because we have been ignoring data pointing us to this transition for the past few weeks (or months). So, I remain a better seller of risk here, though won’t fight a rally at the start of the week too much (if one materializes).
Credit. Reduce exposure to the weakest credits and those most tied to the economy. We could see a period where economic conditions warrant a rate cut, but inflation fears keep the Fed on the “higher for longer” mantra. That should hurt some of the weaker credits, but I don’t see a material threat to overall risk, unless we see stocks respond more negatively than they have.
Good luck and May 5th is my favorite day of the year!
Loading…