New Study: Human Emissions ‘Irrelevant’ In Determining Changes In Atmospheric CO2 Since 1959
“The main factor governing the annual increase in atmospheric CO2 concentration is the SST [sea surface temperature] rather than human emissions.” – Ato, 2024
Another day, another new scientific paper has been published reporting efforts to curb anthropogenic CO2 emissions are “meaningless.”
In this study multiple linear regression analysis was performed comparing SST versus anthropogenic CO2 emissions as explanatory factors and the annual changes in atmospheric CO2 as the objective variable over the period 1959-2022.
The model using the SSTs (NASA, NOAA, UAH) best explained the annual CO2 change (regression coefficient B = 2.406, P = <0.0002), whereas human emissions were not shown to be an explanatory factor at all in annual CO2 changes (regression coefficient B = 0.0027, P = 0.863).
Most impressively, the predicted atmospheric CO2 concentration using the regression equation derived from 1960-2022 SSTs had an extremely high correlation coefficient of r = 0.9995.
Thus, not only is the paradigm that says humans drive atmospheric CO2 changes wrong, but “the theory that global warming and climate change are caused by human-emitted CO2 is also wrong.”
“SST has been the determinant of the annual changes in atmospheric CO2 concentrations and […] anthropogenic emissions have been irrelevant in this process, by head-to-head comparison.”
Image Source: Ato, 2024
This is not the first study to have addressed this lack of correlation between annual changes in atmospheric CO2 and anthropogenic CO2 emissions.
Wang et al. (2013) assessed that CO2 emissions derived from human activity (fossil fuel combustion and land use changes) only account for about +0.1 to 0.3 PgC/yr of the annual change in CO2 concentration. This is about “10% of the variance (σ²) of the CO2 growth rate.”
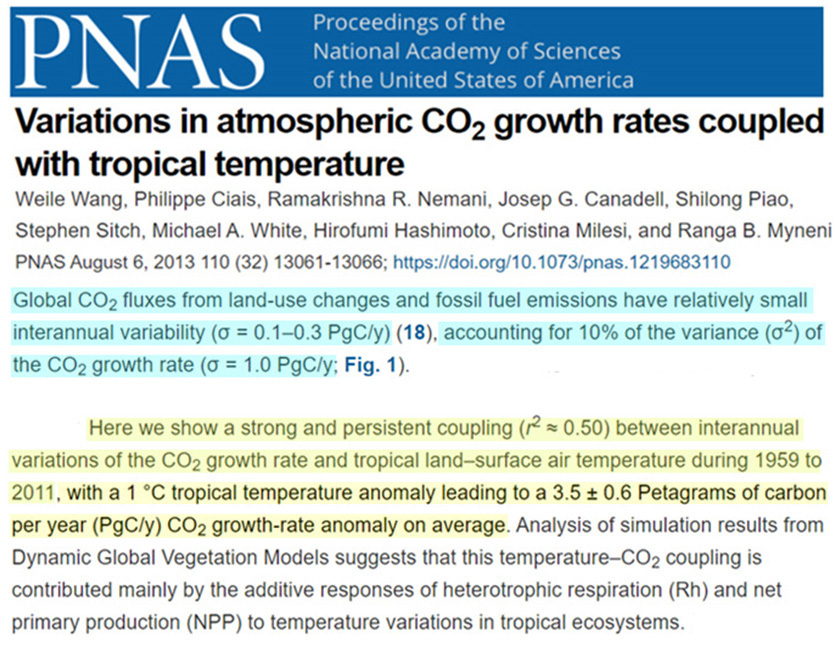
Image Source: Wang et al., 2013
Jones and Cox (2005) have pointed out that the changes associated with annual fossil fuel emissions are unlikely to explain CO2 growth rate anomalies.
“…it is unlikely that these anomalies can be explained by an abrupt increase in anthropogenic emissions, as the anomalies are much larger than annual increases in fossil fuel emissions.”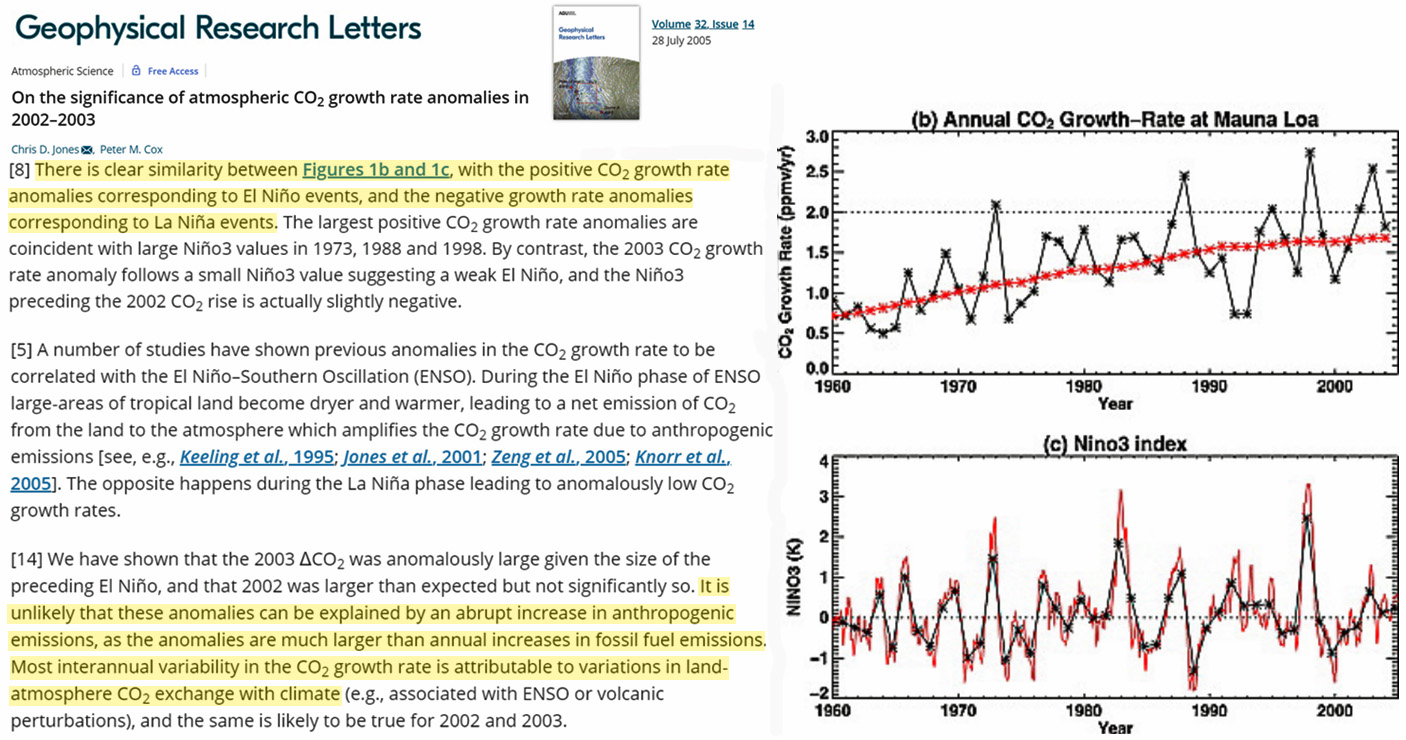
Image Source: Jones and Cox, 2005
Dr. Jari Ahlbeck (2009) also assessed the correlation between fossil fuel emissions and the increase in CO2 growth rates is “clearly statistically insignificant.” He therefore excluded this factor from consideration in his analysis of the mechanisms of CO2 variability.
A chart included in the body of the paper reveals 5-year periods where there was either a decline in the annual CO2 emissions trend (5.33, 5.17, 5.13, 5.11, 5.29 GtC/yr for 1980-1984) or a flattened trend (6.40, 6.53, 6.63, 6.59, 6.57 GtC/yr for 1995-1999).
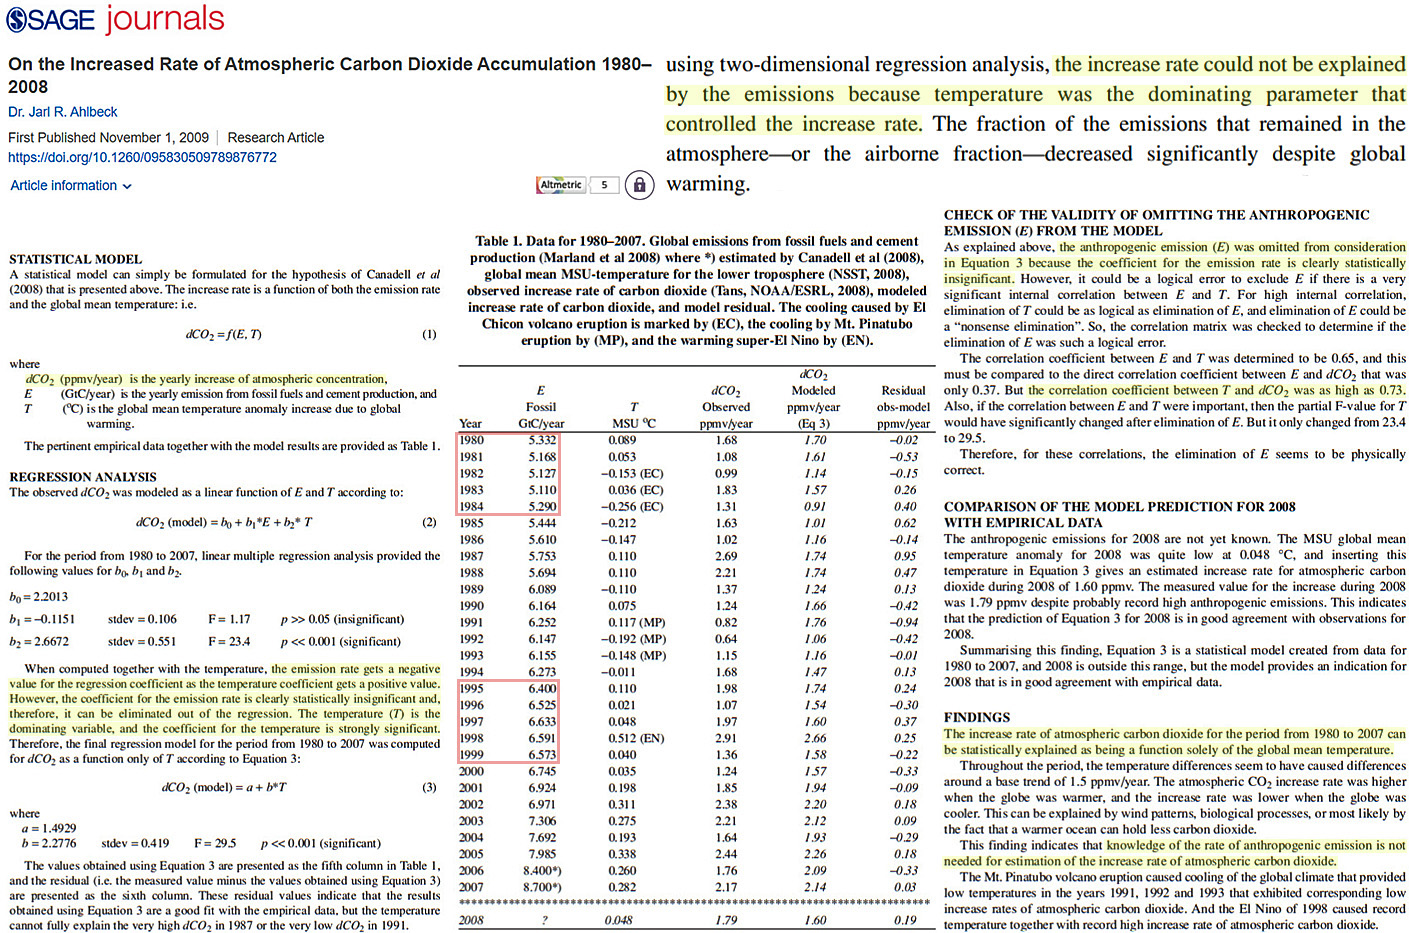
Image Source: Ahlbeck, 2009
Even an analysis detailed in the Carbon Brief blog from a few years ago suggests “global CO2 emissions have been flat – if not slightly declining – over the past 10 years.” This obviously does not support the conclusion that an increase in the CO2 growth rate has been driven by flat to declining human emissions.
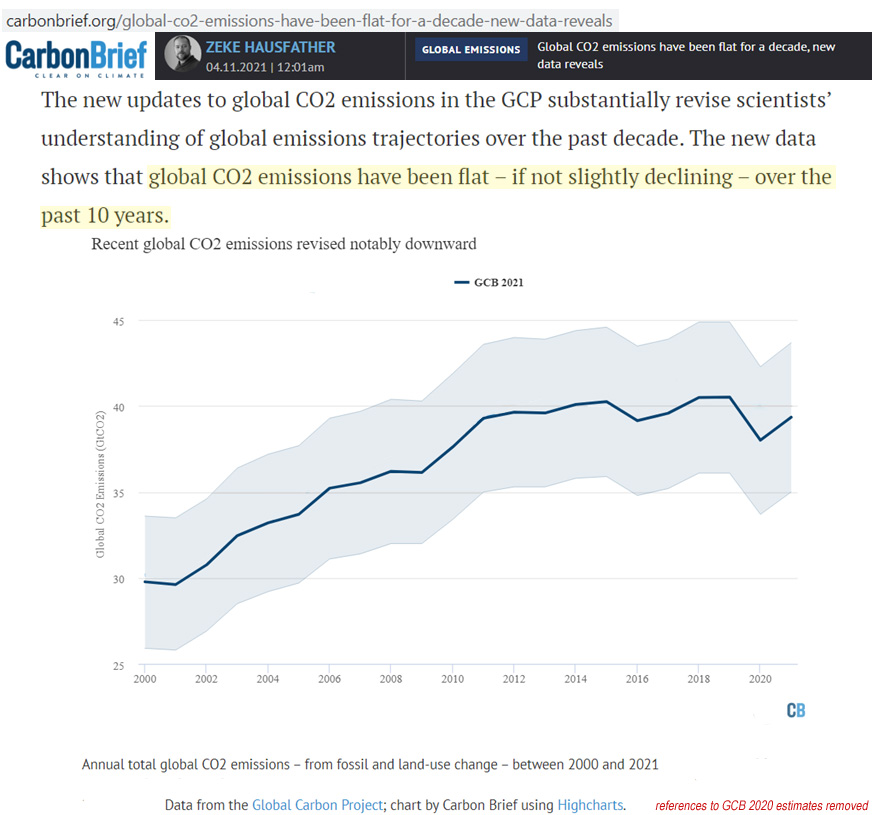
Image Source: Carbon Brief
An additional side note found in the Ato paper addresses the lack of a link between human methane emissions and atmospheric methane growth rates.
Although human methane emissions have risen dramatically in recent decades, “atmospheric methane concentrations have declined since the 21st century.”
“…natural fluctuations are far more powerful than human emissions in terms of the influence on atmospheric methane levels.”
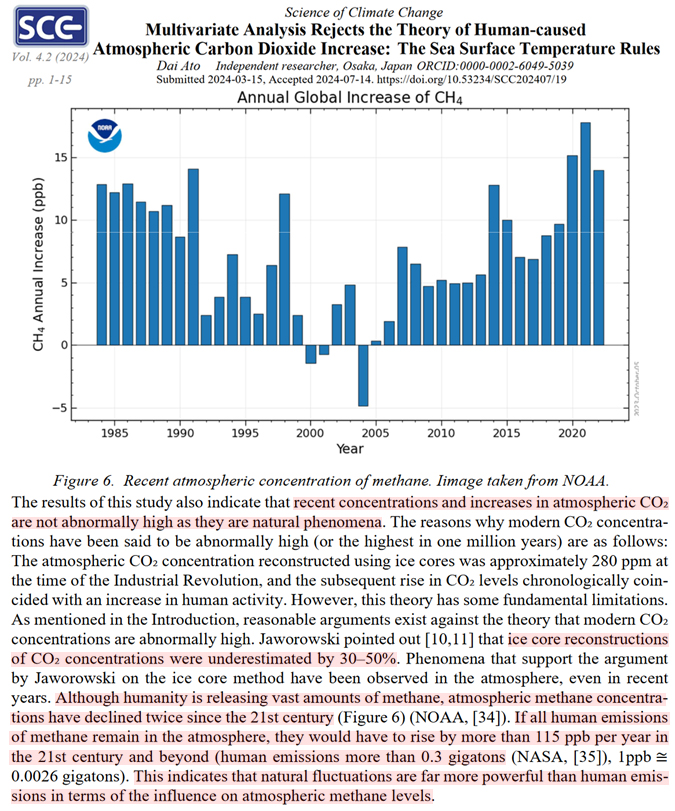
Image Source: Ato, 2024
So we not only have a lack of correlation between human emissions and annual variations in atmospheric CO2 (and CH4), we even have flat to declining trends in annual anthropogenic CO2 (and CH4) emissions in recent decades – the opposite explanatory directionality.

